12 — Combine → Game Validation
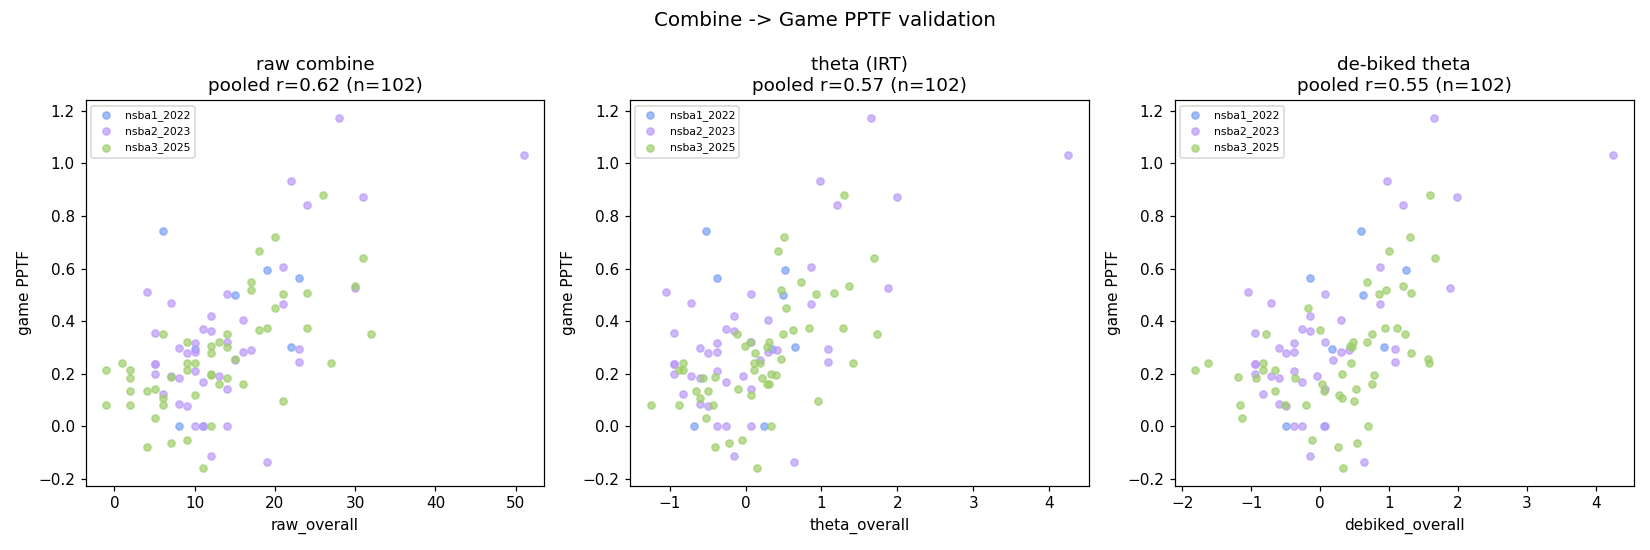
12 — Combine → Game Validation
Goal. For players linked combine↔game, quantify how well the combine (raw,
IRT theta, and de-biked theta) predicts real-game PPTF (toss-up points per
toss-up faced, standard Science-Bowl scoring). Overall and per category, plus
two stress tests: (a) regular vs playoff games, and (b) suspected bikers
(tanking_risk) — does the combine break down where the prior says it should?
- Script:
scripts/combine_to_game.py - Inputs:
player_season_master.csv,combine_ability.csv,team_season.csv, plus game-levelgames_meta/game_player_box/tossups_long(to split PPTF byis_playoffand by subject). - Outputs:
outputs/combine_to_game.png,outputs/combine_to_game_linked.csv - Env:
/home/david/code/nsba/.venv/bin/python
Two scoring worlds, never mixed. The combine is pyramidal & gameable; the game value metric (PPTF) is standard SB (+4/−4/+10). Combine appears only as a predictor; PPTF is the out-of-sample target. Game data trusted over combine (prior D7).
Cohort & method
- 102 player-seasons link combine→clean games with ≥2 games (stable PPTF):
nsba3=51, nsba2=43, nsba1=8. Clean game set =
reconciles==True & not(0-0)= 180 games (the standard guardrail). - PPTF denominator = recorded TUH where present, else season-mean tossups/game (nsba3 has no per-player TUH → estimated; treat nsba3 PPTF as a games×rate proxy).
- Predictors:
raw_overall(recorded combine, era-specific units),theta_overall(IRT EAP),debiked_overall(gameable signal down-weighted) — all from finding 10. - Correlations are Pearson (Spearman shown for robustness); regression is RidgeCV with predictors and target z-scored within season and 5-fold CV R².
Results
1. Overall: combine moderately predicts game PPTF
Pearson r vs game PPTF (n in parens):
| predictor | pooled | nsba1 (8) | nsba2 (43) | nsba3 (51) |
|---|---|---|---|---|
raw_overall |
0.618 | 0.24 | 0.64 | 0.64 |
theta_overall |
0.571 | −0.00 | 0.64 | 0.60 |
debiked_overall |
0.547 | 0.56 | 0.64 | 0.47 |
Pooled Spearman: raw ρ=0.566, theta 0.503, debiked 0.478. Against denominator-free points-per-game the picture is identical (raw r=0.621). Combine is a moderate predictor — r ≈ 0.62, explaining ~38% of PPTF variance. Real game value is far from determined by the tryout.
De-biking earns its keep only on nsba1 (the heavily-biked Energy era): debiked 0.56 ≫ raw 0.24 ≫ plain theta −0.00. On the clean per-question seasons (nsba3) de-biking hurts (0.47 vs raw 0.64) because there's little biking to remove and it discards real cheap-but-correct credit. This reproduces finding 10's conclusion on an independently re-built PPTF and confirms it is robust.
2. Regularized regression (z-scored within season, 5-fold CV)
| feature set | CV R² | standardized coef |
|---|---|---|
| raw only | +0.346 | 0.597 |
| theta only | +0.293 | 0.560 |
| debiked only | +0.275 | 0.539 |
| theta + debiked | +0.299 | 0.30 / 0.25 |
Raw combine is the single best linear predictor (CV R²≈0.35). Adding de-biked to theta does not improve out-of-sample fit pooled — the two are collinear and the de-biking gain is nsba1-local, washed out when pooled.
3. Per-category: each combine category predicts its own game subject
Combine-category signal vs that subject's game PPTF (players with ≥3 subject toss-ups faced):
| combine cat | game subj | r(theta_cat) | r(combine_cat total) | n |
|---|---|---|---|---|
| bio | b | 0.431 | 0.515 | 99 |
| chem | ch | 0.474 | 0.512 | 99 |
| cs | cs | 0.462 | 0.404 | 91 |
| ess | ess | 0.502 | 0.496 | 99 |
| math | m | 0.543 | 0.484 | 99 |
| phys | p | 0.384 | 0.388 | 99 |
Every category's combine signal predicts the matching game subject (all r in 0.38–0.54) — domain-specific signal genuinely transfers; the combine isn't just a single g-factor. Math and ESS transfer best; physics weakest.
On the CS prior: CS theta (0.462) is mid-pack, not visibly cleaner than the bikable categories. So in this linked cohort the "CS = unbikable, cleaner signal" prior (D7) is not confirmed at the category level — CS predicts game-CS about as well as bio/chem predict their subjects, no better. (Caveat: CS exists only in nsba2/nsba3, so this is a 2-season test.)
4. (a) Regular vs Playoff — combine degrades in harder games
Only nsba3 has playoff games (12 clean), so this test is nsba3-only. Paired (same 36 players who played ≥1 playoff game), combine→PPTF:
| predictor | regular-season r | playoff r |
|---|---|---|
raw_overall |
0.698 | 0.590 |
theta_overall |
0.671 | 0.525 |
Combine predicts playoff PPTF noticeably worse than regular-season PPTF (raw drops 0.70→0.59; theta 0.67→0.53). Direction supports the intuition that the gamed tryout signal washes out against stronger competition / higher-leverage games. Caveat: playoff PPTF rests on estimated (not sheet) TUH and only 12 games / 36 players — directional, not conclusive.
5. (b) Bikers (tanking_risk) — direction supports gaming, but n is tiny
Semantic note: tanking_risk='low' = low risk of tanking (a reliable player
whose combine should be clean); 'med' = the actual suspected-tanker group.
Linked cohort: 13 low (reliable), 2 med (suspected), 87 unrated.
- Reliable (low-risk) players' combine predicts much better: raw r=0.847 (n=13) vs unrated r=0.581 (n=87). Combine is most trustworthy exactly for players independently rated as non-tankers — consistent with the gaming story.
- Suspected tankers under-deliver vs their combine. Residual test (fit PPTF_z ~ raw_combine_z on all non-suspected players, then compare actual−predicted):
| group | mean residual (actual − combine-predicted PPTF_z) | n |
|---|---|---|
| suspected tankers (med) | −0.090 | 2 |
| reliable (low) | +0.241 | 13 |
| unrated | −0.036 | 87 |
Suspected tankers sit below their combine-implied line (combine over-rates them); reliable players sit above. Both signs point the way prior D7 predicts — the combine is a gamed ceiling for tankers, an honest floor for reliable players. But n=2 for the suspected group makes this suggestive only, not significant.
Bottom line
- The combine is a moderate, real predictor of game value: pooled r≈0.62, ridge CV R²≈0.35. It is a useful seed, not ground truth — ~⅔ of PPTF variance is unexplained by the tryout.
- Raw combine ≈ best predictor overall; de-biking only helps in the biked nsba1 era (where it nearly triples the correlation), as designed.
- Per-category signal transfers for all six subjects (r 0.38–0.54). The hoped-for CS-is-cleaner effect does not show up here.
- Two gaming-consistent signals, both directionally supportive but underpowered: combine predicts playoff games worse than regular (0.70→0.59), and combine is a tighter predictor for rated-reliable players (0.85) than the pool (0.58) while over-rating the 2 suspected tankers.
Limitations
- Small n everywhere it matters. nsba1 n=8; playoff test 36 players / 12 games; suspected-tanker group n=2. Treat the two stress tests as directional.
- nsba3 PPTF uses estimated TUH (paired layout records no per-player heard count) — a games×rate proxy, not exact; this is the season carrying the playoff and most per-category weight.
tanking_riskis sparse and nsba4-era, mapped onto a player's every season via canonical_id; it is a qualitative discord flag, not an audited label.- Cross-season scale.
raw_overallunits differ by season; all pooled correlations are computed without rescaling raw (theta/PPTF z-scoring is used in the regression). Per-season numbers are the safer read. - nsba2 combine is aggregate-only, so its theta is a z-scored Overall (no item resolution) — its 0.64 correlations are real but lower-resolution than nsba3's.
Reproduce
/home/david/code/nsba/.venv/bin/python scripts/combine_to_game.py
Prints all tables above; writes outputs/combine_to_game.png and
outputs/combine_to_game_linked.csv (the 102-row linked cohort).