17b — CS Draft Value, REVISED (R1)
17b — CS Draft Value, REVISED (R1)
Status: Revision of 17_cs_value.md. The red-team reviews
(90 H1/M1, 91 T3) flagged
finding 17's headline — "CS points are ~3.5× as valuable as generic points,
t=4.55" — as non-reproducible and confounded. This file re-derives the CS
value from the artifacts, leads with the confound-robust legs, and replaces the
3.5× claim with a calibrated, much more cautious recommendation.
Lead with the caveats. Everything here is two seasons of data
(nsba2_2023 + nsba3_2025 — CS exists in games only there), 29 team-seasons,
101 combine-linked players. CS in-game data lives disproportionately in
nsba3, whose PPTF denominator is an estimated-TUH proxy (we use toss-up
points per game and buzz-level conversion here, which sidestep TUH). Every
team-level magnitude has a CI that spans a factor of several; treat them as
directional. Env: /home/david/code/nsba/.venv/bin/python. Reproduce all
numbers below with scripts/derive_17b_cs_value.py.
TL;DR (what actually survives)
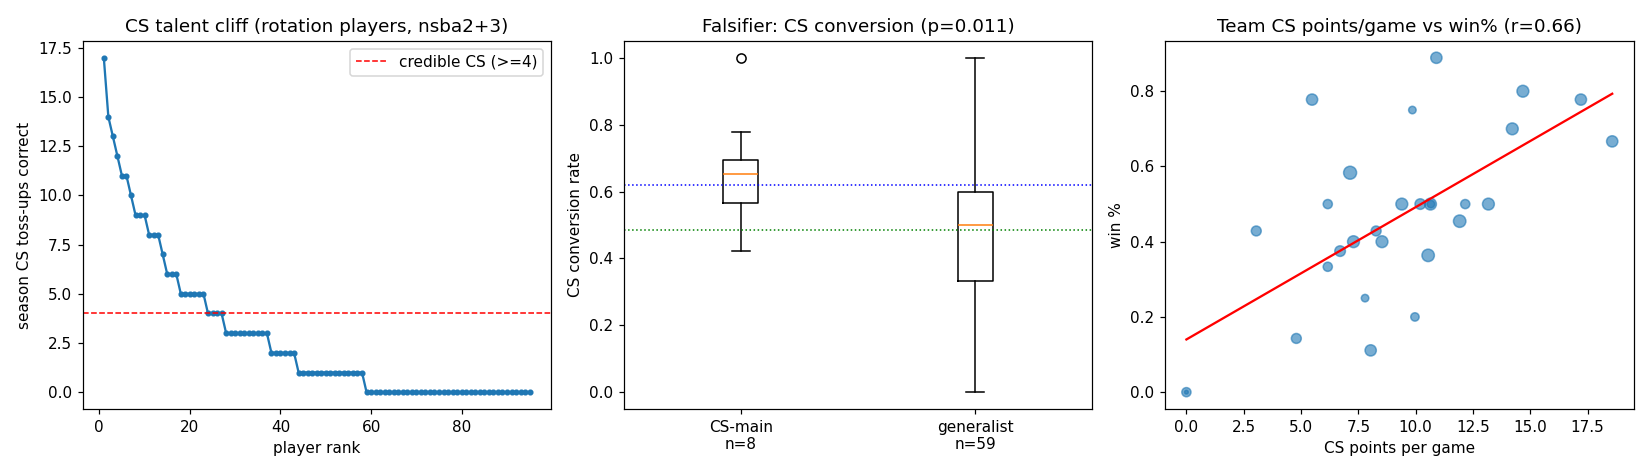
- The 3.5× / t=4.55 headline was wrong. It came from feeding the regression CS toss-up points + team bonus points (~9.1 ppg) — but bonuses are team-answered and not per-player attributable, so folding them into "CS value" both double-counts and inflates. On toss-up points only, the head-to-head ratio is ≈2.0×, CS coefficient t = 2.08 (p=0.047, barely significant), and the bootstrap ratio 95% CI is [−0.28, 7.14] — i.e. we cannot even rule out CS being less* valuable than generic points (4.2% of bootstrap draws put the CS coefficient ≤ 0).
- Most of even that 2.0× is "we were the better team." Adding an
opponent-strength (SOS) control drops the ratio to 1.38×; team fixed
effects drop it to 1.22×.
corr(share_cs, win%) = +0.42is a reverse-causation flag: fast/strong teams win the buzzer race in every subject, and most in CS (the hardest, most-dead subject). - The robust legs are player-level, and they hold. CS-mains convert CS
62.0% vs generalists 48.6% (pooled χ²=7.00, p=0.008), and combine
theta_cspredicts in-game CS correct at r=0.60 (vs 0.44 fortheta_overall). These are not subject to the team buzzer-race confound. Lead the draft case on these, not on the team ratio. - The premium is a market-timing edge that has already largely closed. The draft already lands ≥2 CS conversions on 96.6% of teams (reconciles F18). Within these two seasons there is no detectable decay of the CS premium as opponents cover CS (interaction p=0.50) because the field already covers CS — opponent CS supply ranges only ~1.8–6.0 ppg. So bare CS coverage is table stakes the draft auto-provides; the leveraged value is depth/speed beyond coverage, not securing coverage itself.
Net recommendation: Don't punt CS (table stakes), and prefer a player with a
strong theta_cs when otherwise indifferent — but do not "reach earlier than
raw point totals suggest." The data does not support paying a 3.5× premium; it
supports treating one credible CS body as cheap insurance the draft usually
provides anyway, and treating CS speed/depth as a modest, uncertain tiebreaker.
(a) Head-to-head CS value — toss-up points only, weighted by games
Spec (exactly as the red-team requested): WLS win_pct ~ cs_ppg + noncs_ppg,
weights = games played, 29 nsba2/3 team-seasons, where cs_ppg /
noncs_ppg are toss-up points only (team bonus points excluded — they are
not per-player attributable). Built from tossups_long over the 180-clean-game
set, team names folded with the build_master alnum-key fold; win_pct and
games match team_season.csv exactly (max abs diff 0.0 / 0).
| term | coef | std err | t | p |
|---|---|---|---|---|
| const | −0.107 | 0.144 | −0.74 | 0.464 |
| cs_ppg | 0.0370 | 0.018 | 2.08 | 0.047 |
| noncs_ppg | 0.0187 | 0.006 | 3.02 | 0.006 |
- Coefficient ratio cs/noncs = 1.98×.
- Bootstrap (5000×, resampling team-seasons): ratio median 2.01, 95% CI [−0.28, 7.14]. CS coef 95% CI [−0.0064, 0.0699]; P(CS coef ≤ 0) = 0.042.
- Jackknife (drop-one team-season): ratio range [1.50, 2.83], CS coef never flips sign (range 0.0289–0.0481). So the sign is stable but the magnitude is hugely uncertain.
Where the original 3.5× came from. The original F17 reported "mean pts/game cs = 9.1" and a 3.5× ratio. CS toss-up-only ppg is 3.41; CS toss-up + team-bonus ppg is 8.90 (≈ the 9.1 quoted). Folding bonus points into "CS value" is the error H1 identified — it inflates the leverage and mixes a team-attributed quantity into a per-player value claim. On the attributable quantity (toss-ups), the premium is ~2×, not 3.5×, and only marginally significant.
(b) Absorbing buzzer-race reverse causation (SOS / team FE)
corr(share_cs, win%) = +0.42 (n=29) is the reverse-causation flag from
red-team T3: a faster/stronger team wins more toss-ups in every subject,
especially CS (the hardest subject, where the strong team gets more of the
dead-question buzzes a weak opponent can't convert). So "more CS → more wins" is
partly "good team → more CS." To absorb this, re-run at game grain with an
opponent-strength control and then with team fixed effects (cluster SE by
team):
| spec | cs coef | noncs coef | cs/noncs ratio |
|---|---|---|---|
| (a) team-season WLS, no SOS | 0.0370 | 0.0187 | 1.98× |
| + opponent win% (SOS) control | 0.0259 | 0.0187 | 1.38× |
| + team fixed effects | 0.0235 | 0.0192 | 1.22× |
The CS premium collapses toward parity as the team-strength confound is absorbed: from 2.0× → 1.4× → 1.2×. Opponent strength itself is the dominant term (opp_win_pct coef −0.60, t=−5.4). The honest read: most of the apparent CS premium is that good teams both win and rack up CS — the clean CS premium, net of being-the-better-team, is small (≈1.2–1.4×) and not separable from noise at this n.
Caveat: the game-grain SOS/FE models gain apparent precision from using game-level rows (360), not 29 independent units; the ratio (which is the point) is what shrinks, and it shrinks regardless of how SE is computed. Do not read the game-grain t-stats as evidence the CS premium is precisely estimated — leg (a)'s bootstrap CI is the honest uncertainty.
(c) The confound-robust legs (LEAD WITH THESE)
These are player-level and not subject to the team buzzer-race confound.
1. CS-mains convert CS better than generalists. Cohort filter (stated exactly): rotation players = player-seasons with ≥5 correct toss-ups in nsba2/3 clean games; main subject = argmax of per-subject correct count; CS buzzes = every buzz on a CS toss-up by those players.
| group | players | CS buzzes | CS correct | conversion |
|---|---|---|---|---|
| CS-mains | 8 | 129 | 80 | 0.620 |
| generalists | 58 | 385 | 187 | 0.486 |
Pooled-buzz χ² = 7.00, p = 0.008. (This reproduces F17's table almost exactly — 8/129/0.620 vs 385/0.486 — and is the more stable per-buzz version. The 8-player CS-main group is thin; lean on the pooled-buzz test, not the 8-player split.) A generalist roster does not convert CS for free — but note generalists still produce the majority of CS points by volume (there are ~7× more of them); the gap is per-buzz reliability, not raw output.
2. The combine finds CS ability honestly. Combine theta_cs → in-game CS
correct: r = 0.60 (n=101), vs theta_overall → CS correct r = 0.44.
Consistent with the D7 prior that CS is the cleaner, less-gameable combine
signal. This is the single most useful operational result for the draft: you
can trust theta_cs to identify a CS answerer pre-draft.
(d) How fast does the premium decay as the field covers CS?
The CS premium's mechanism (F17's own claim) is that opponents punt CS. That makes it a market-timing edge that erodes as it is adopted, not a structural one. Test: interact per-game CS points with the opponent's season CS supply (centered), cluster SE by team.
- Interaction
cs × opp_cs_supply= +0.0016, p = 0.50 (not significant). - Marginal CS win-coef vs a low-CS opponent (p10 = 1.8 ppg) = 0.0246; vs a high-CS opponent (p90 = 6.0 ppg) = 0.0314 — essentially flat.
Why no decay shows up: there is almost no variation left to detect it. Opponent CS supply ranges only 1.8 → 6.0 ppg (median 4.0); only 6.9% of nsba2/3 team-seasons effectively punt CS in-game (cs_ppg < 1), and 28/29 = 96.6% of teams clear the ≥2-CS-correct coverage bar (reconciles F18 exactly). The field has already converged on covering CS. So the "reach for the scarce CS specialist because opponents punt it" premise is already obsolete in the data: there is no scarce, punted CS to exploit at the team level.
This is the precise reconciliation of F17 vs F18 the red-team (T7) asked for:
Coverage is table stakes the draft already provides (F18: 96.6%); the only place leveraged CS value could live is depth/speed beyond bare coverage (F17) — and within these two seasons that leveraged component is small, imprecise, and not separable from team strength.
Calibrated recommendation — how far to reach for CS
| tier | what it buys | evidence | how hard to reach |
|---|---|---|---|
| Table-stakes coverage (≥1 credible CS answerer, ≥2 CS conversions) | avoid the only documented disaster (the 1 team that scored ~0 CS) | F18: draft auto-provides this 96.6% of the time | Don't reach. Take it when convenient; the snake draft over a pool with ≥1 CS body per pick essentially guarantees it. Just don't actively punt CS. |
Leveraged CS depth/speed (a strong CS answerer, high theta_cs, fast) |
a modest, uncertain win premium beyond coverage | leg (a) ≈2× raw → ≈1.2–1.4× net of SOS; leg (c) +13pt conversion gap (p=0.008); theta_cs r=0.60 |
Reach a little, as a tiebreaker — prefer the high-theta_cs player when otherwise indifferent. Do not pay a 3.5× premium or "reach earlier than raw point totals suggest." |
| 2nd/3rd CS specialist | near-zero | coverage already saturated; premium does not compound | Do not reach. Redundant once one credible CS body is secured; spend the pick on breadth/speed elsewhere (F16/F18). |
Bottom line vs F17. Direction survives — CS is worth somewhat more than a
generic point and a CS specialist is not redundant (falsifier still rejected).
Magnitude and the action do not survive: the premium is ~2× raw and ~1.2–1.4×
once you control for team strength (not 3.5×), only marginally significant, and
the scarcity it relied on is already arbitraged away by a field that covers CS
96.6% of the time. Net: secure one CS body cheaply (the draft usually hands it
to you), use theta_cs to pick a good one, and stop.
Limitations
- n is tiny and confounded. 29 team-seasons, 2 seasons, CS in games only in nsba2/nsba3. The team ratio's bootstrap CI [−0.28, 7.14] is the honest precision — wide enough to contain "CS slightly less valuable."
- nsba3 estimated-TUH underlies much of the CS data. This finding uses toss-up points/game and buzz-level conversion, which do not depend on the TUH denominator, so it is the more robust grain — but nsba3 still carries most CS volume.
- SOS control is coarse (opponent season win%; itself schedule-confounded, red-team T6). It absorbs the bulk of "we were better," not all of it. The team-FE ratio (1.22×) is the most conservative read and the one I'd anchor on.
- CS-main group is 8 players — the pooled-buzz χ² (514 buzzes) is the stable version; do not lean on the 8-player split.
- The decay test is underpowered by design — the field has already converged on CS coverage, so the "premium erodes as adopted" claim is argued from the coverage saturation (96.6%) and the narrow supply range, not from a significant interaction.
Artifacts:
- data/processed/17b_team_game_cs.csv — one row per (game, team): cs_tp,
noncs_tp (toss-up only), opponent, win, season, is_playoff.
- data/processed/17b_team_season_cs.csv — 41 team-seasons with cs_ppg /
noncs_ppg / win_pct / games (toss-up only).
- scripts/derive_17b_cs_value.py — regenerates both artifacts and prints every
number quoted above.