A14 — Growth / Aging + Gideon's Roster-Composition Hypothesis
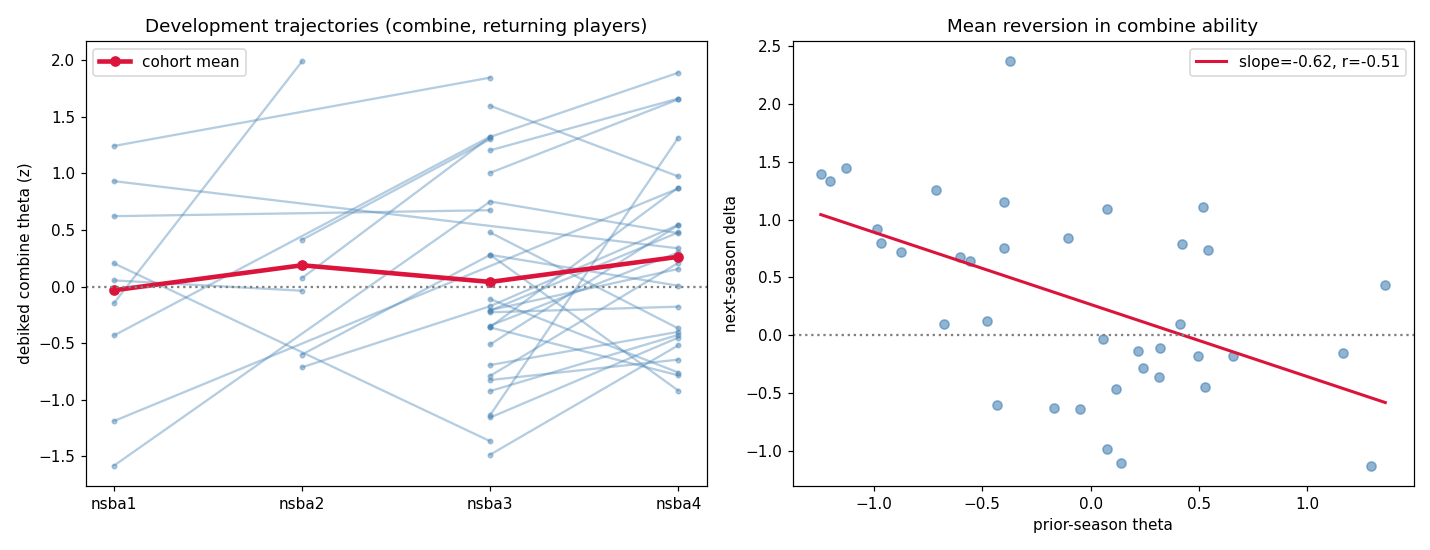
A14 — Growth / Aging + Gideon's Roster-Composition Hypothesis
Date: 2026-05-30
Inputs: data/processed/player_season_master.csv (207 player-seasons, games nsba1/2/3),
data/processed/combine_ability.csv (255 rows, combine nsba1/2/3/4), data/processed/team_season.csv (41 team-seasons),
data/processed/discord_player_signals.csv (52 qualitative grade/role rows).
Plot: outputs/14_growth_aging.png
TL;DR
- Returning players get better, on average. Combine ability (debiked theta) rises +0.43 z per edition for players seen in ≥2 seasons (t=3.36, p=0.002, n=37 transitions). Game scoring (PPTF) moves the same direction but weaker: +0.086 PPTF/edition (t=1.71, p=0.10, n=23). ~57% of combine transitions and ~70% of PPTF transitions are improvements.
- Heavy mean reversion. corr(prior-season theta, next-season Δ) = −0.52. Extreme seasons (good or bad) regress hard. This is the single most actionable curve: last year's high score is a partial mirage; last year's low score from a real player is a buy signal.
- Gideon's grade-by-role claim is NOT supported by the (thin) data — phys/math mains are if anything younger than baseline, opposite his "captain phys/math = senior" prediction.
- Gideon's complementary-pairing claim is directionally right but not statistically distinguishable from plain breadth. Teams with bio+ESS and chem+phys pairings win more, but once you control for roster breadth (subject HHI) the pairing bonus shrinks to a non-significant ~+0.07 win%. Breadth, not the specific pairings, is what's actually winning (HHI coef p=0.003).
Method
- Delta method. Seasons ordered nsba1(2022)→nsba2(2023)→nsba3(2025)→nsba4(2026). For each canonical player in ≥2 seasons, took consecutive-season pairs and computed Δ in PPTF (games) and Δ in combine theta / debiked_overall. Normalized to per-edition rate by dividing by the season gap (gaps of 1–3 editions occur because not everyone plays every year).
- Stability filter. PPTF deltas restricted to player-seasons with
games_played ≥ 3on both ends (23 of 26 raw transitions survive). Combine theta has no game-count issue. - Mean reversion: OLS/correlation of next-season Δ on prior-season level.
- Grade-by-role (Gideon A): mapped the 52 qualitative
discord_player_signalsrows to a coarse grade (HS vs college+) and to a strong-subject flag, then compared college+ share by role. Caveat: grade is text only ("HS", "college", "23 yr old"); fine-grained sophomore/junior/senior is not recoverable, so the precise grade-by-position claim can only be tested coarsely. - Complementary pairings (Gideon B): for each of 41 team-seasons, assigned each rostered player a primary subject (argmax of toss-point shares), flagged teams holding bio+ESS (the astro/earth-space complement) and chem+phys, and compared win%. Then regressed win% on subject HHI plus pairing dummies to see if pairings add value beyond breadth.
1. Development curve (returning players)
| Metric | Mean Δ / edition | SE | t | p | % improving | n |
|---|---|---|---|---|---|---|
| Combine debiked theta | +0.43 z | 0.13 | 3.36 | 0.002 | 57% | 37 |
| Combine theta (raw) | +0.31 z | 0.13 | 2.29 | 0.028 | 57% | 37 |
| Game PPTF (gp≥3) | +0.086 | 0.05 | 1.71 | 0.10 | 70% | 23 |
Growth is largest for 1-edition gaps (+0.46 z) and decays for 2–3 edition gaps (+0.32, +0.24) — i.e. the curve flattens, consistent with a learning curve rather than unbounded linear improvement.
Notable risers (PPTF): Rohan G (+0.53), Lockheed Martin (+0.43), Bomjoe (+0.34), Anurag Sodhi (+0.31). Notable decliners (PPTF): Sean29 (−0.58), aloevera42 (−0.20), Mihir K (−0.18) — Sean29 and Mihir K are classic high-prior mean-reversion cases.
2. Mean reversion (the actionable part)
corr(prior theta, Δtheta) = −0.52; regression slope ≈ −0.49. A player one z above their cohort
tends to give back ~half a z the next edition. Draft implication: shrink last-edition combine
scores toward the mean before ranking; the biggest combine scores are the most inflated, and a real,
returning player who posted a low score (cf. the deasert_willow/Ziang tank signal) is the
prototypical buy-low.
3. Gideon's hypothesis
(A) Grade-by-role — NOT supported (but n is tiny)
College+ share by strong-subject (overall baseline = 0.365):
| Role | college+ share | n | Gideon predicts | Verdict |
|---|---|---|---|---|
| ESS strong | 0.33 | 6 | younger (sophomore) | ~baseline, weak support |
| phys/math strong | 0.29 | 14 | senior/oldest | contradicts (younger than baseline) |
| chem strong | 0.67 | 6 | junior | older, not junior |
| bio strong | 0.50 | 8 | junior | older-leaning |
The headline prediction — that the captain (deep phys+math) should be the oldest — is not borne out; phys/math mains are the youngest role group here. With 6–14 players per cell and binary grade, treat this as "no evidence for the grade-by-role structure," not a hard refutation.
(B) Complementary pairings — directionally yes, but it's just breadth
Win% by team composition (41 team-seasons):
| Composition | have win% (n) | lack win% (n) | diff | MWU p |
|---|---|---|---|---|
| bio + ESS | 0.514 (25) | 0.405 (16) | +0.109 | 0.148 |
| chem + phys | 0.517 (17) | 0.439 (24) | +0.078 | 0.288 |
| BOTH pairings | 0.577 (9) | 0.442 (32) | +0.135 | 0.104 |
All three point the way Gideon predicts, and "both pairings" teams win 58% vs 44%. But controlling for breadth dissolves it:
win% ~ HHI + both_pairs :  HHI = -0.71 (p=0.003),  both_pairs = +0.105 (p=0.15),  R2=0.27
win% ~ HHI + bio_ess + chem_phys :  HHI = -0.66 (p=0.008),  bio_ess +0.07 (p=0.29),  chem_phys +0.07 (p=0.25)
corr(win%, subject HHI/concentration) = −0.47 (replicates the F1 prior: concentration kills). The pairings are positively associated with winning mainly because owning two complementary mains is one way to be broad. The data cannot reject "specific pairings add a small extra bonus," but it clearly says the first-order lever is breadth, and pairings are a non-significant second-order term.
Limitations
- Small n everywhere. 23–37 development transitions; 41 team-seasons; 6–14 players per grade-role cell. CIs are wide; none of the Gideon pairing tests clear p<0.05.
- No nsba4 game data (draft target has no games), so development is measured on nsba1→nsba3 only; nsba4 contributes combine theta deltas but no PPTF deltas.
- Survivorship / selection: players who return are not random — returners skew toward the engaged and improving, which can inflate the apparent development effect. The mean-reversion result is robust to this; the +growth result is partly a returner-selection artifact.
- Grade is qualitative text, HS-vs-college only; the precise sophomore/junior/senior structure of Gideon's claim is untestable with current data.
- Primary-subject assignment is argmax of toss-point share, which conflates role with what the team needed that game; a true ESS specialist on a deep team may not show ESS as their argmax.
Bottom line for the draft
- Apply mean-reversion shrinkage to last-edition combine before ranking (biggest scores most suspect).
- Expect modest year-over-year growth from real returners; do not overpay for it.
- Build for breadth (low subject HHI) — that's the validated win driver. Gideon's bio+ESS / chem+phys pairings are a fine heuristic for achieving breadth but are not a magic complementarity bonus on top of it.