20 — Difficulty Normalization ("Park Factors")
20 — Difficulty Normalization ("Park Factors")
Goal: quantify how question difficulty differs across contexts and produce adjustment factors so player tossup stats are comparable across seasons, playoff/regular, and subjects. Identify which season is most comparable to the nsba4 draft target.
Date: 2026-05-30. Env: /home/david/code/nsba/.venv/bin/python.
Inputs: tossups_long.csv, bonuses_long.csv, games_meta.csv (GAME data only —
standard Science-Bowl scoring, never combine). Outputs:
outputs/difficulty_factors.csv, outputs/difficulty_factors.png.
Method
Difficulty is measured at the question level, not the player level, because a
question-level metric is largely independent of which player is on the floor,
whereas per-player point rates (PPTF) are confounded by roster strength, opponent,
and role. The primary metric is conversion = fraction of toss-up questions
that some team answered correctly (any_correct). Lower conversion = harder
questions. (Dead rate = 1 − conversion.)
- Clean game set (guardrail):
games_metafiltered toreconciles==TrueAND not(score_a==0 & score_b==0)→ 180 games (nsba1=66, nsba2=61, nsba3=53), inner-joined totossups_long. Subjects filtered to the 7 canonical codes (b ch cs ess m p ene); junk subjects dropped. 4,318 questions with a canonical subject after collapsing buzz rows to one row per question. - Decomposition: logistic regression
any_correct ~ C(season) + C(subject)separates context difficulty from subject difficulty (subjects aren't mixed evenly across seasons — e.g. nsba1 has Energy, no CS; nsba3 has CS). Season difficulty is read off as the model-predicted conversion holding the subject mix fixed to the 5 common subjects (b ch ess m p). - Playoff effect: added as
+ playoffto the same logit; also reported as a raw within-nsba3 ratio (playoff games exist cleanly only in nsba3 — see caveat).
Results
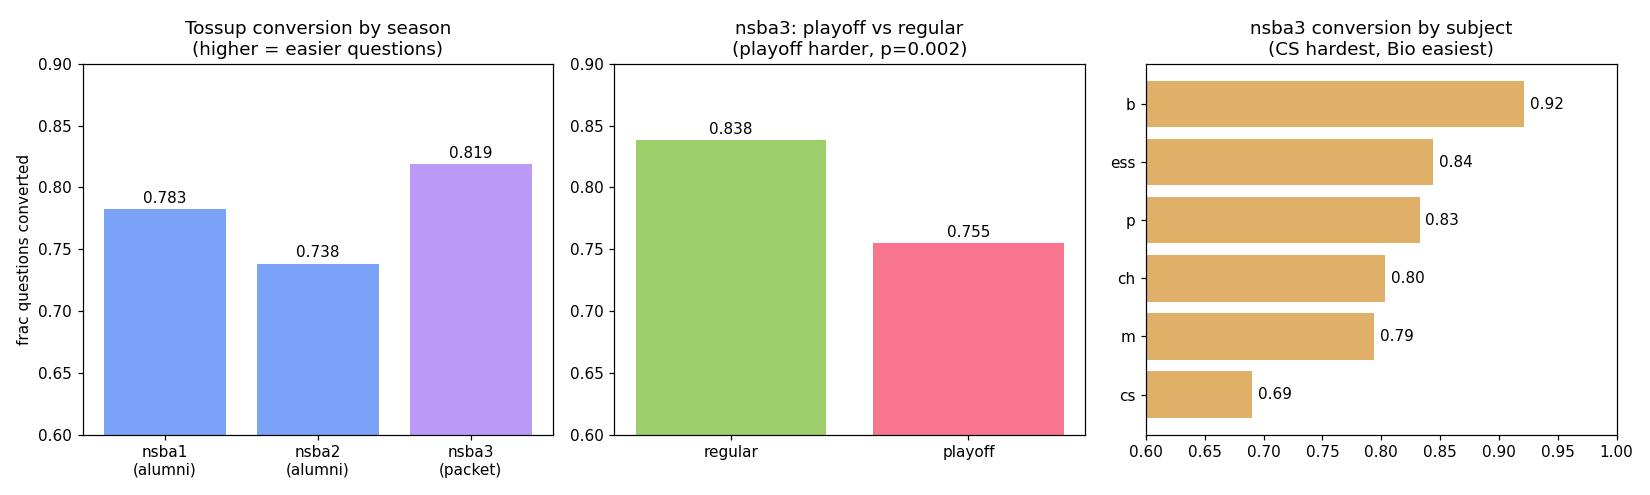
(a) Season / era difficulty
| season | era | raw conversion | subject-adjusted conversion | difficulty factor → nsba3 |
|---|---|---|---|---|
| nsba1_2022 | alumni-written | 0.783 | 0.761 | 1.089 |
| nsba2_2023 | alumni-written | 0.738 | 0.754 | 1.100 |
| nsba3_2025 | packet-submission | 0.819 | 0.829 | 1.000 (reference) |
nsba3 questions are easier (highest conversion) than the alumni-era seasons.
The difficulty_factor is nsba3_adj_conv / season_adj_conv: multiply a player's
nsba1 toss-up rate by 1.089 (nsba2 by 1.100) to express it in nsba3-equivalent
units. The era axis (alumni vs packet) lines up with this: both alumni seasons
are ~9–10% harder than the packet-era nsba3.
Player-anchored corroboration (noisy, small n, PPTF is a games×rate proxy for nsba3): players appearing in both nsba2 and nsba3 scored higher in nsba3 (mean PPTF 0.25→0.54; n=5), and nsba1→nsba2 rates rose too — directionally consistent with each later season being easier, but these ratios are too confounded by roster/opponent to use as the factor; the question-level model is the anchor.
(b) Playoff vs regular season
Within nsba3 (the only season with clean playoff games):
- regular conversion 0.838, playoff conversion 0.755.
- Logit
playoffcoefficient: OR = 0.592, p = 0.002 — playoff questions significantly harder. - Playoff difficulty factor = 1.111 (
reg_conv / playoff_conv): multiply a player's playoff toss-up rate by ~1.11 to compare to regular-season output.
(c) Per-subject baselines (nsba3 reference)
nsba3 mean conversion = 0.819. subject_factor = mean / subject_conv (>1 = harder
subject, so each correct buzz there is "worth more"):
| subject | conversion | n | subject factor |
|---|---|---|---|
| b (Bio) | 0.921 | 203 | 0.889 (easiest) |
| ess (Earth/Space) | 0.844 | 205 | 0.971 |
| p (Physics) | 0.833 | 203 | 0.984 |
| ch (Chemistry) | 0.803 | 208 | 1.020 |
| m (Math) | 0.794 | 199 | 1.032 |
| cs (Comp Sci) | 0.690 | 155 | 1.187 (hardest) |
CS is the hardest subject to convert and Bio the easiest — consistent with the prior that CS is the "unbikable" / cleaner-signal subject.
Bonus conversion (secondary context check)
Bonuses earned per correct toss-up: nsba1 0.497, nsba2 0.438, nsba3 0.562 (nsba3 playoff 0.512 < regular 0.575). Same direction as toss-up difficulty — nsba3 easiest, playoffs harder.
Which season is most comparable to nsba4?
nsba3_2025. nsba4 is the same packet-submission era as nsba3 (vs the alumni-written nsba1/nsba2), includes CS (like nsba2/nsba3, unlike nsba1), and uses the modern 6-subject set (no legacy Energy). nsba3 needs no season adjustment (factor 1.0) as the reference; nsba1/nsba2 player stats should be scaled up by ~1.09–1.10 before comparing to nsba4 expectations.
How to use outputs/difficulty_factors.csv
To put a player's per-context toss-up rate on a common (nsba3/nsba4-equivalent)
scale, multiply by the relevant difficulty_factor. Factors are roughly
composable (season × playoff × subject) but were each estimated holding the others
at their reference, so treat the product as approximate. The factors adjust the
value of a correct buzz (rarity), not a player's speed.
Limitations / caveats
- Playoff factor is nsba3-only. All 9 nsba1 playoff games are non-reconciling (corrupted sheets, excluded by the guardrail); nsba2 had no playoffs. So the playoff adjustment is one season's evidence (n=265 playoff questions) and may partly reflect stronger surviving teams facing each other rather than purely harder packets.
- Conversion conflates question difficulty with field strength. A season's conversion is lower if questions are harder or if the player pool is weaker. The two-way logit removes subject-mix differences but not pool-strength differences. Player-anchored checks point the same way but are too thin (n=2–20 cross-season players) to be definitive.
- nsba3 PPTF denominators are estimated (paired layout records no per-player TUH), so any PPTF-based cross-check for nsba3 is a games×rate proxy.
- Subject factors are nsba3-only baselines by design (the nsba4-comparable season); subject conversion is not stable across seasons (e.g. Bio 0.79→0.92), so do not assume the nsba1/nsba2 subject mix has the same internal difficulty.
- Energy (
ene, nsba1) and CS (nsba2/3) don't co-occur, so their cross-season difficulty can't be compared directly. - Sample sizes are modest (155–264 questions per subject-season); factors are point estimates, not tightly bounded.